Overview of Airborne Geophysical Survey

The need to re-invigorate the solid minerals sector necessitated Federal Government of Nigeria to embark on the provision of quality geosciences data through an airborne geophysical survey programme. Contract was awarded to Fugro Airborne Surveys (Fugro) to carry out the survey over the areas designated Blocks A & C and B in the “Phase I” programme. This was after their successful execution of the Ogun State Pilot Project in 2003. This exercise represented 44% national coverage. The project was carried out under the supervision of the Nigerian Geological Survey Agency (NGSA), a parastatal of the Ministry of Mines and Steel Development.

Following the success achieved in the Phase 1 programme, the World Bank, through the Sustainable Management of Mineral Resources Project (SMMRP) Nigeria also commissioned Fugro Airborne Surveys (Fugro) to conduct the Phase II airborne survey, representing the remaining 55% coverage of Nigeria’s landmass.

These data collected in the two phases were in the magnetic, radiometric, gravity and electromagnetic domain. The surveys were mostly flown at 500 m line spacing and 80 m mean terrain clearance generating a total of about 2 million line-km data.

2003 Pilot Project Ogun State
2005-07 Phase I Blocks A+C and B
2007-10 Phase II Blocks D1, D2, D3, D4 and D5

A higher resolution time-domain electromagnetic surveys were flown at 200 m line spacing based on the results of Phase 1 exercise. This was conducted from 2008-09 with the Tempest System over three blocks, totalling 24,000 line-km. To complete the exercise, airborne magnetic and gravity surveys were carried out over the Niger Delta block (D5) at 1 km and 4km line spacing respectively.

Interpretation

Phase I data was interpreted by Fugro Airborne Surveys while the interpretation of Phase II was carried out by Paterson, Grant & Watson Limited (PGW) of Canada.

The interpretation was carried out at 1:250,000 scale on Nigeria’s standard map layout, with a nationwide synoptic interpretation at the 1:1,000,000 and 1:2,000,000 scales. Each map sheet incorporates two interpretation products namely:

1. Litho-structural geophysical interpretation – basement, intrasedimentary and sedimentary units evident in the geophysical data together with structure
Landform and regolith interpretation – surficial material and geomorphology.

2. Index map of the airborne survey blocks flown between 2003 and 2010 for the Nigerian Geological Survey Agency (electromagnetic surveys not shown). In the background is the 1:2,000,000 Geological Map of Nigeria (NGSA, 2006).

Download Magenetic Data

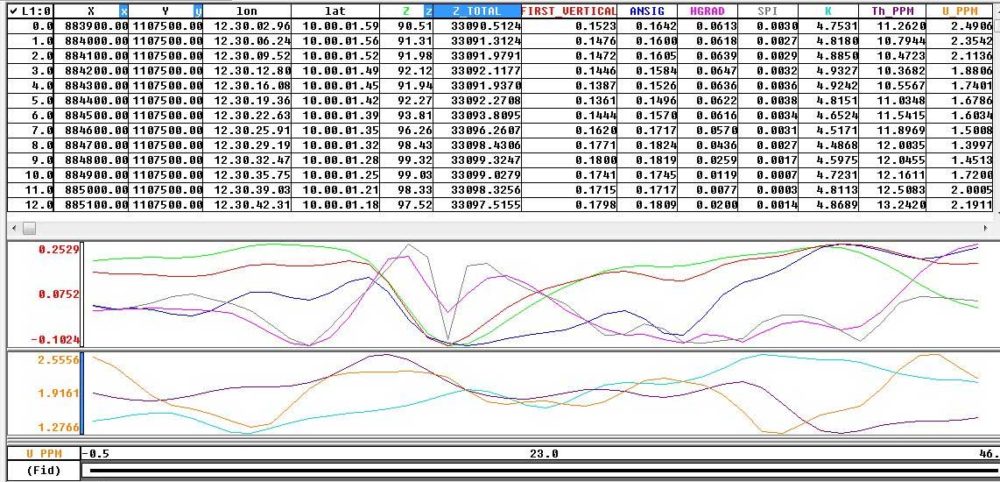
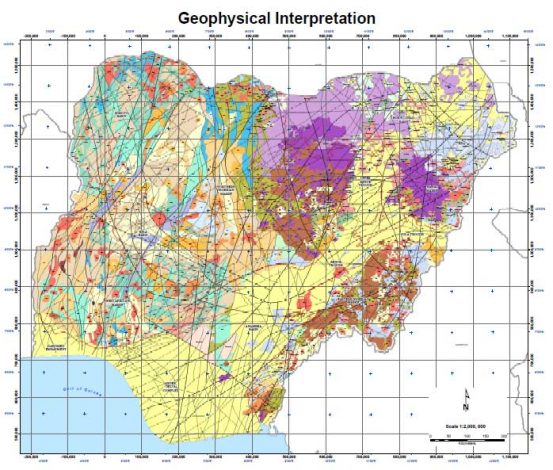
The Nigerian Geological Survey Agency is hereby presented for public consumption a section of the results of the survey. These include 1:50,000 magnetic data both in Geosoft grids and ASCII files. Where available, interpreted results are also provided.

The data are available for free downloads using appropriate search engines. Comments are welcome. This is to enable us serve you better.

Survey Processing Specification

The Total Magnetic field Intensity data ZTotal was acquired and processed by Fugro A.S. PTY. As much as 3 Scintrex Cesium vapour magnetometers mounted in about 7 Cessna Caravan fixed-wing aircrafts at a time were used in acquiring the data. This complex arrangement coupled with seasonal variations required innovative approach in survey planning, instrument calibration, data compilation and grid merging. The data recording interval was 0.1s or less than 7m. Projection method used in processing the data was the Universal Transverse Mercator (UTM) and the WGS 84 as Datum. The Spheroid model used was the Clarke 1880 (modified), 33ºE Central Meridian, a scaling factor of 0.9996, a 500,000m X Bias, a 0m Y Bias and 50m grid mesh size were the plotting specification. Most of the data was collected between 2005 and 2009; hence an IGRF 2005 model was used for the calculation of declination and inclination.
The Total Magnetic field Intensity value Z was stripped of 33,000nT for ease of processing. A simple arithmetic addition of 33,000nT to each value of Z therefore gives you the ZTotal. All other derivatives (1VD, ANSIG, HGRAD, SPI, etc were computed from either Z or ZTotal. In computing the derivatives, series of filtering and reductions are applied to the 2D gridded data in both wave number and Fourier domains to achieve one or many of the following processes: Reduction of magnetic data to the magnetic pole or equator, First/second/nth vertical derivatives Upward/downward continuations to any horizontal surface, Apparent magnetic susceptibility maps from magnetic field, Optimum Wiener depth filter, Conversion between different directional components of the field, regional/residual separation filters, De-corrugation and directional filters or First/second/nth horizontal derivatives.

Sample Database